The Bears Win this Bitcoin Price Battle

 It appears a tug of war between the bulls and the bears, stalemated for a while, is finally being tilted toward the bears. For several days now, in the shorter term time frames, there has been a preponderance of evidence or clues, that the market wanted to go lower. As markets are known to do, it stubbornly refused to do so. Eventually gravity wins, and what wants to go down, does go down, especially when popular webwallets have security flaws.
8-hour Chart
 Let’s look at the 8-hour chart we saw last night. Note that for the first time since the October low, we have had a close beneath the support line we discussed last night. This event is decidedly bearish and should not have been missed by any bitcoin trader looking at an 8-hour chart. The pennant we looked at yesterday was also broken to the downside, at just about the exact place we expected. The high was just a bar away from the point labelled “e” on yesterday’s chart. As I’m sure is obvious, breaking out of a pennant to the downside is very bearish.
5-hour Chart
 On a 5-hour chart we see the market looking like it will give us a close below the 3rd arc pair, and below the Gann 3×1 line. The close hasn’t happened yet, but if it does, it will be another bearish signal.
3-hour Chart
 On a 3-hour chart, we see that as soon as the market cleared the 3rd arc pair price immediately turned down. As you can see, the arc pair had been providing support. A bearish signal indeed.
2-hour Chart
 Finally, the 2-hour chart shows that the turn down began just a single bar after hitting the end of the square. The end of the square is an energetic time. Price has closed below the (green) support line from October. For now ar least, it has found support at the (maroon) Gann 8×1 line. The bitcoin price ratio page shows there are significantly more sellers than buyers.
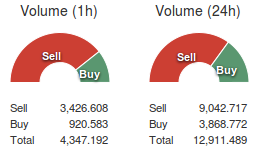
So Where Is the Support for This Market Likely to Be Found?
On the 2-hour chart I see support at 363, 357, 335 and 328. On the 5-hour chart I see support at 357, 350 and 336. On the 8-hour chart, the bottom of the square, the lowest I believe it will go per the 8-hour Gann setup, is at 240. For Elliott Wave reasons we can discuss another time, I have a very hard time believing price will go lower than the April 2013 high of 266. Two different charts see support at 357 and 328, so it is not unreasonable to suspect we will see a bounce at 357, and then at 328, if/when price gets there.
Summary
I believe we are entering the final phase of a year-long bear market. It should not be surprising that markets might like to shake out all the weak hands before the next bull market begins. These next couple weeks are apt to be interesting times. Happy Trading all!
Images from Shutterstock.
