

I decided to write about Bitcoin again to start the week, since the other coins are rather sedate today.
As some of you know, the last few articles were about Bitcoin. A couple days ago the coin was in a state where it pretty much had to do something. It was at a point where I thought it might break down temporarily, but to my surprise it broke upwards. What does that mean? Well, for one thing it means the bulls are still in charge, even if they have been struggling the last 40 hours or so.
That, coupled with the fact that the coin is still putting higher highs and higher lows suggests that maybe I need to focus more on bull setups, and less on bear setups. And I’m glad I did, because there is something interesting to see today.
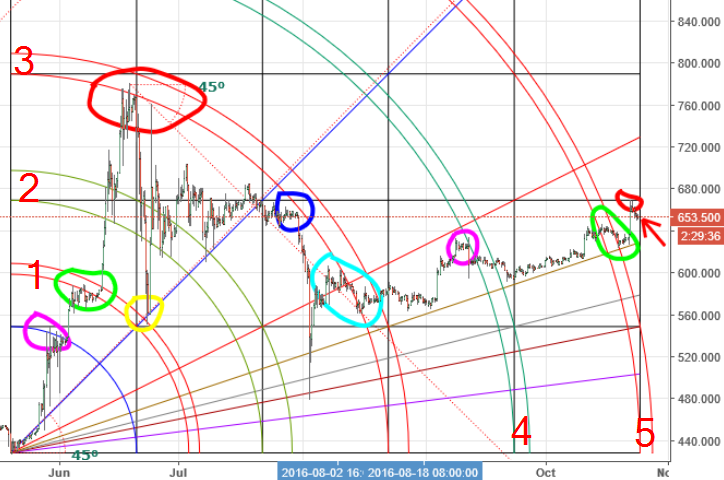 I have labelled the arc pairs, so that it is easy to identify which ones I am referring to. The setup above starts in May and tops 8 days later. (This is an 8 hour chart, by the way.) You will note that the market has respected this setup at almost every turn. Let’s follow along the chart….
The 1st arc pair stopped price for a bit.
The 3rd arc pair not only stopped price, but kicked it in the butt hard EXACTLY at the end of the 1st square. Knocked price all the way back to the 1×1 Gann angle (yellow circle).
Price bounced back to the 3rd arc pair and was knocked down hard again. Moved sideways until it hit the 3rd arc pair again and was knocked down a 3rd time by the same arc. Rebounded, hit the 3rd arc pair a 4th time and was knocked down a 4th time, but this time not so much. Pricetime moved exactly along the 3rd arc until it finally got through the arc pair. FINALLY. Imagine that – the exact same resistance curve had stopped price for just over 2 months!
Price then moved up sharply until it hit the 4th arc pair, which knocked it down, but not so very far. Price quickly recovered and moved upwards and sideways along the 1×3 Gann angle (gold color) until it was stopped – after the recent rally – by the top of the 2nd square.
Here’s the interesting thing… The chart is now just a couple 8 hour bars from the end of the 5th square in time. My guess is that this timeframe will mark either a reversal or an acceleration. That typically happens at the end of a setup. The fact that the 5th arc pair did not cause price to fall is a bit bullish. The 1×3 Gann angle has not been broken on this chart for almost 3 months, and then just very briefly.
My finger is on the trigger to put in a buy order if/when this chart shows signs of breaking upwards. Stay sharp…
Happy trading!
Remember: The author is a trader who is subject to all manner of error in judgement. Do your own research, and be prepared to take full responsibility for your own trades.
