Bitcoin Issues a Buy Signal on the Daily Chart

Bitcoin has indicated that it intends to break through the 3rd arc resistance we have been watching on these pages for the past several weeks. Barring an unexpected intraday reversal, we will get a close above the arc today. The implications of this can hardly be overstated. It means we will most likely be getting a buy signal on a long-term daily chart. I believe we are about to witness a thrilling few weeks.
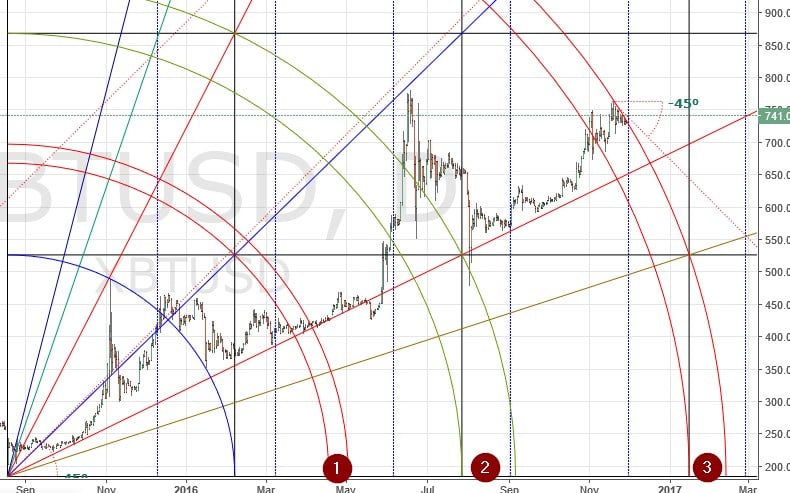 It is well worth noting that the resistance breakthrough came EXACTLY, to the day, 90 degrees after the rally of Sept 2. We have been watching this date for well over a week, and it turned out that it was the very day the breakthrough came.
4th arc resistance is quite high. It is over $1,000. There is strong resistance on the shorter-term setup ~ $850. So it is highly likely there will be a pullback there. But imho we are likely going to see $1,000 broken again, probably by the end of the year.
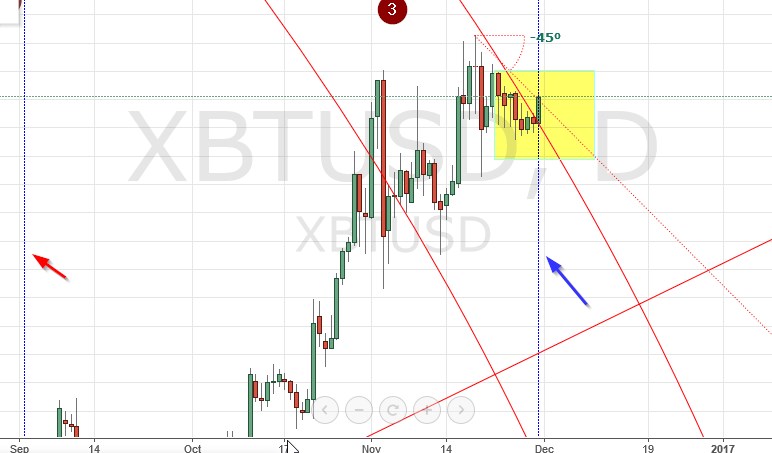 As of this writing, price is stopped by the 1×1 angle from the recent swing high. But given that the 3rd arc pair, which stopped price for the entire month of October, has finally fallen, I suspect that 1×1 resistance will fail quickly.
There will likely be some hesitation at the recent high ~ $780. But if/when that hesitation is overcome we will likely see a march to $850. After that? We will cross that bridge when we get there.
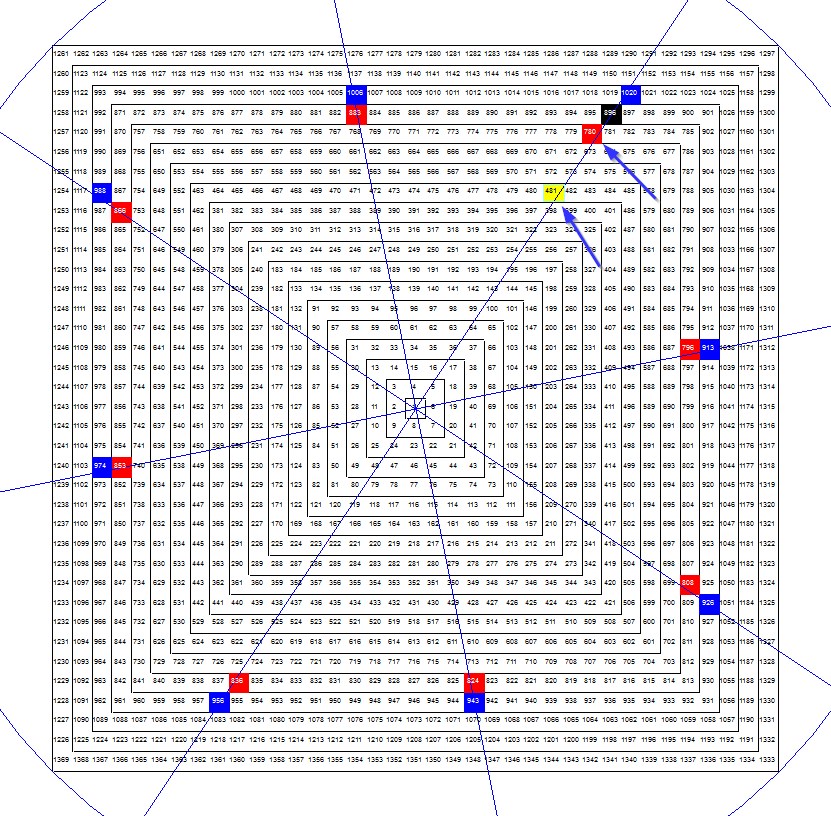
Here is a Gann Square of 9 which might highlight potential points of resistance along the way.
Happy trading!
Remember: The author is a trader who is subject to all manner of error in judgement. Do your own research, and be prepared to take full responsibility for your own trades.
