

If you follow cryptocurrencies for a while you start finding weird and interesting patterns, scattered around a variety of technical data. It may not seem like much, but sometimes looking away from price into other statistics can give you a refreshing view on the market.
Bearish trends can tell us more about the future, you might think.
From psychological trends, to hash rate and difficulty analysis, my goal today is to peak around shadows usually left to be.
If we actually stop to think for a second about how the universe works, we might realize most of what is actually happening, which directly affects our lives, is plain and simply unknown. Like dark energy and dark matter, which combined compose about 90% off all matter in existence, to learn more about price behavior we probably want to look the somewhere else.
Here’s how I think about it: you know on “Law and Order”, “CSI” or whatever crime show you like to watch on netflix, when the good guys catch the bad guy during the first 10 minutes and you’re like “hummm.. I’m pretty sure this isn’t the right guy”?
That’s precisely what I mean.
–This article shouldn’t be taken as financial advisement as it represents my personal opinion and views. I have savings invested in cryptocurrency so take whatever I write with a grain of salt. Do not invest what you cannot afford to lose and always read as much as possible about a project before investing. Never forget: with great power, comes great responsibility. Being your own bank means you’re always responsible for your own money—
The ‘Kansas City Shuffle’
You look left and they fall right
The Kansas City Shuffle is a type of con which depends on the mark realizing they’re being conned, but incorrectly guessing how it’s being done. When they try to foil the fake con they think they’ve uncovered, they fall into the real con. This con is most effective against marks who are “too smart for their own good”, and will try to beat the conman at his own game instead of backing off when they discover he’s trying to con them.
In my analogy, the conman is the price, as it baffles you with its volatility virtues, while you could be looking somewhere else for direction.
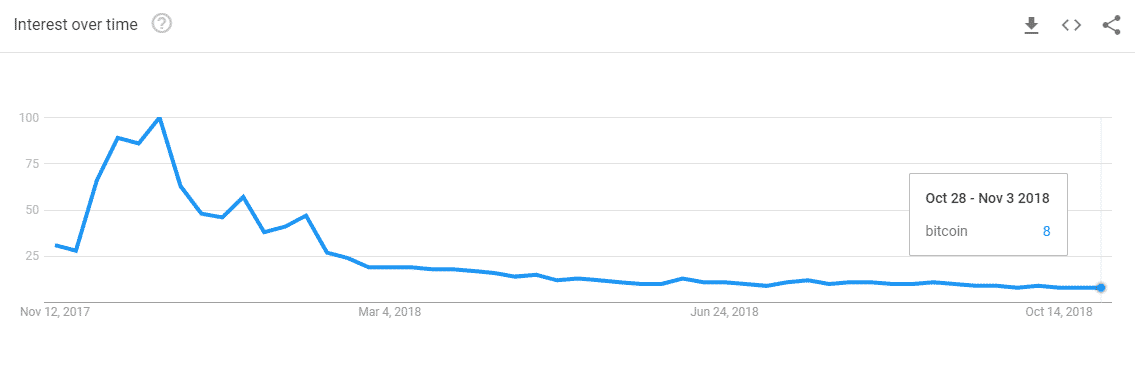
Let’s start with the market sentiment: it dictates market behavior. If you want a neat tool to understand when it’s a perfect time to sell, check google trends. People lookup bitcoin the most when prices are at its highest. I would argue it’s within our nature to buy when prices are high due to excessive FOMO and huger for quick profits. That’s why it is so important to be a contrarian when it comes to making decisions.
However, do not fall for the typical lie “a continuous bearish sentiment will eventually drive prices upwards”.
It can always get worse before it gets better.
Always.
Anything that can go wrong will go wrong
Of course, when everyone is looking right, that’s when you should be looking left.
My personal piece of advice? Learn which foes to take on. If you’re going against the entire market, the chances are, you’re going to lose.
Badly.
It’s a much safer bet to follow smart-money and not go against it. At least, that’s my own observation. If you don’t know how to start, here are a few tips:
First: buy when there’s blood on the streets;
Second: buy the rumors, sell the news;
Third: buy when there’s fear, sell when there’s hype.
Simple stuff, right?
Difficulty Adjustment
One of the most interesting indicators I’ve found as of late was the (possible) correlation between the hashing algorithm difficulty adjustment and price swings.
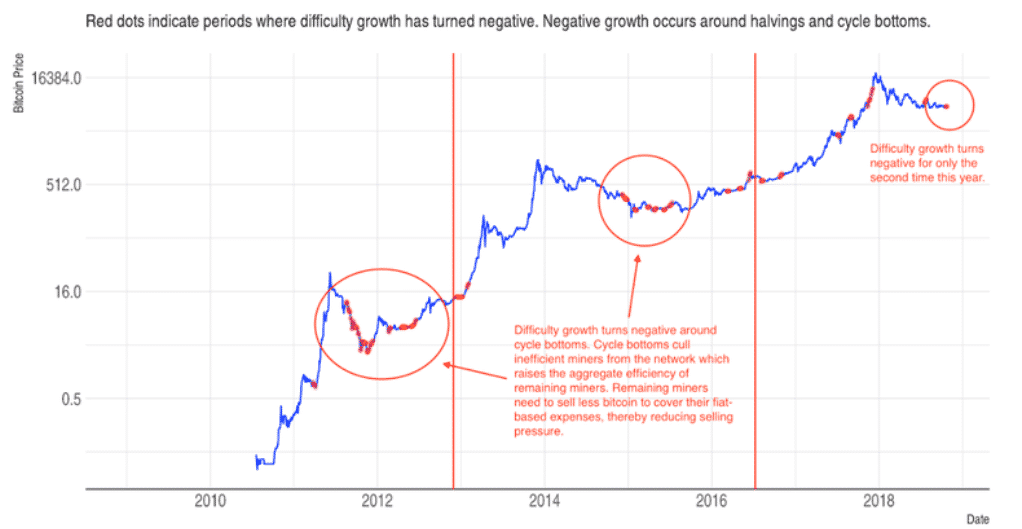
According to Element, “Historical cycles suggest that we may need to experience 6 to 12 months of negative to flat difficulty growth for prices to bottom.”
If we take into account both the fact people in general seem to be over Bitcoin, as well as, miners are leaving the market, logically we could argue the bearish cycle is coming to an end.
If that assumption is correct, only time will tell.
However, there are two hypotheses we’ve more or less proven to be true:
(a) The more miners leave, the easier it gets to mine Bitcoin, as less energy is needed to mine each block.
(b) The less energy is needed to mine each block, fewer are the costs.
Does that translate in huge price swings? Seems like it. Do those price swings go upwards, every time? Absolutely not.
We need to carefully balance different variables to understand the overall status quo of the market; to clearly see the big picture.
The Bitcoin Whales
What you and I are dying to know is the cause of the next bull-run. Will it finally be institutional investors?
By looking at other data, we might get at least a clue.
For example, I do find interesting in the top 20 richest Bitcoin addresses we can find 4, which have had the very first UTXO created either in 2016 or 2018. But wait, there’s more. By crunching the numbers we can quickly see, on average, one transaction from each address was worth about USD 5,940,740.74.
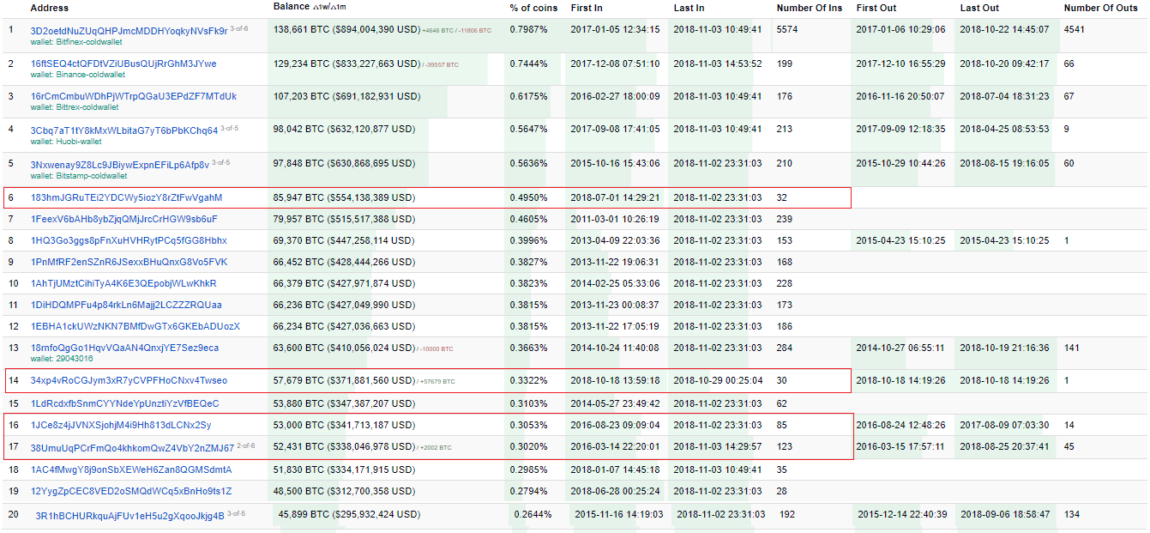
Do you want to hear something really shocking? More than 50% of all top 100 richest addresses have been created within the last 2 years.
Not only that, but all these UTXOs are worth hundreds of times more than all exchanges’ UTXOs combined.
Whatever conclusion you take, one thing is certain: there’s a lot of people with a lot of money invested in Bitcoin, who can potentially change gears and start a race to the top. That’s one out of many possible conclusions.
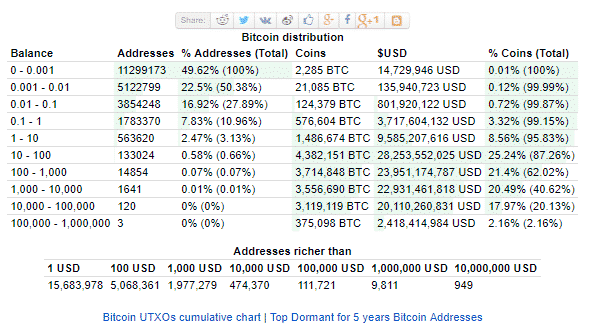
On the other hand, Bitcoin distribution seems to be considerably fairer than most global fiat-currencies, even though I personally do not see the two as comparable, as wealth isn’t usually measured in fiat currency, but rather in physical assets (now digital as well), such as real estate, precious metals or stock.
Hashing Power
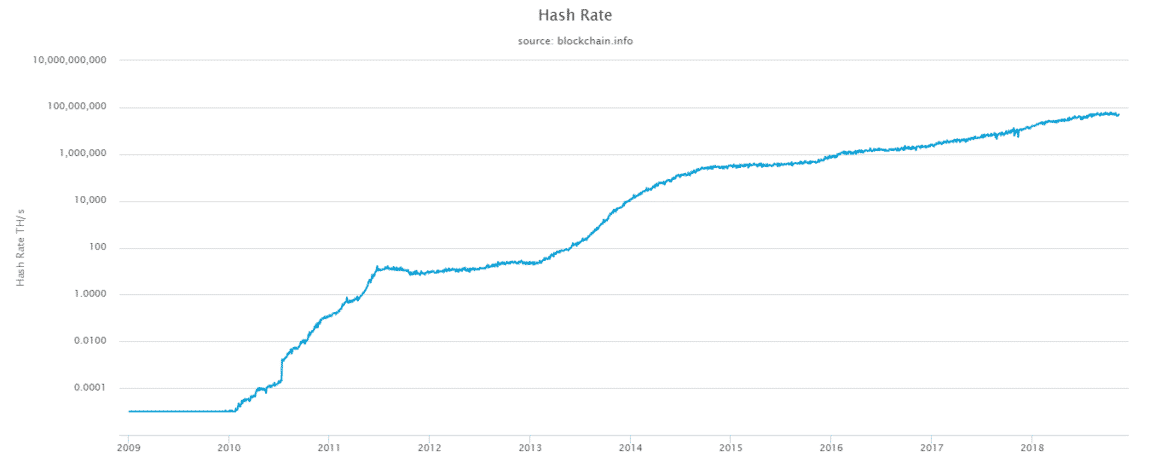
One of the most important metrics for any cryptocurrency success, is hashrate growth . That is, the amount of mining power going towards Bitcoin. Just by looking at the above graph, we can quickly see hashrate has been continuously growing. It took about 10 years to get close to 100,000,000.00 TH/s; I wonder if we’ll reach 1,000,000,000.00 TH/s in less than 5 years.
My suggestion is that you look at fundamental drivers in this market that affect the costs of production above what the miners are likely to expect. Then look at a potential reversal of this negative difference for signals of reduced selling pressure.
More interesting is what comes next .
If we take into account the halving events, which are those points in time highlighted in navy-blue, we can clearly see price seems to follow a rather simple pattern: it is intimately correlated to the amount of Bitcoin in circulation, as well as, the reward per block.
By following those metrics we should arrive at a price between USD 15,000.00 and USD 36,000.00 at the end of 2020.
In the mean-time volatility will play the usual hand, as the less liquid a market is, the easier prices are affected by short-term trading.
Transaction Count
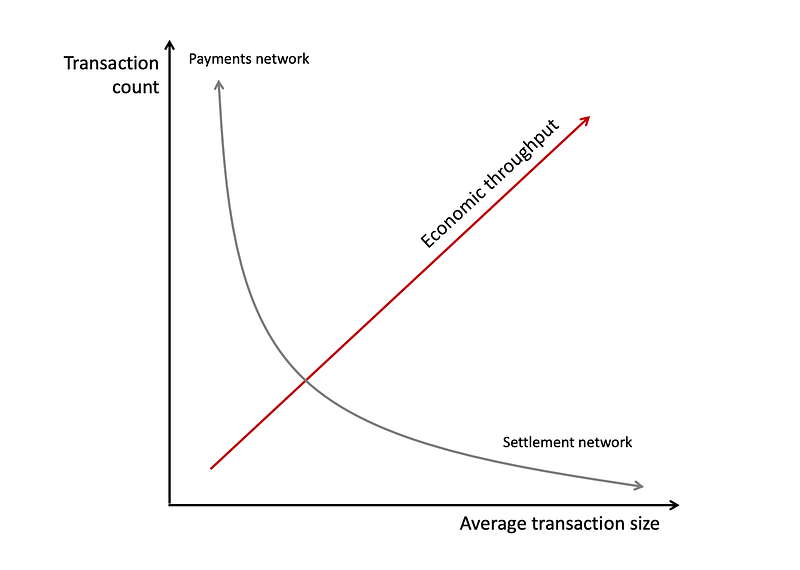
There are at least three important variables to consider when holistically appraising a value transfer system, and the transaction rate is just one of them:
(a) Transaction capacity (tps or transactions per second),
(b) Typical transaction characteristics (transaction size),
(c) Settlement assurances.
Together, transaction rate and average transaction size give you the economic throughput of the system; a measure of its financial bandwidth per unit of time.
Even though Bitcoin is virtual, it is closer to a physical settlement system than a deferred-settlement system like credit cards. Bitcoins are virtual bearer instruments: if you possess the private key which unlocks an unspent output, you are the owner of those coins and entitled to do with them whatever you like. That asset is no one’s liability. In this respect, it more closely resembles physical cash or a commodity like gold.
So how do you consistently compare dissimilar value-transfer systems like Bitcoin, Paypal, Visa, SWIFT, and physical cash? I’d recommend broadening your focus beyond simple transaction count. That’s only one component of economic throughput.
What we should really be interested in is: average transaction size * the number of transactions, which gives us the value flowing through the system per unit of time.
Another key metric is understanding how companies are reacting to Bitcoin and its blockchain technology. Are organizations expanding into implementing blockchain within their businesses? If so, is there any correlation between price and jobs?
Price VS Jobs
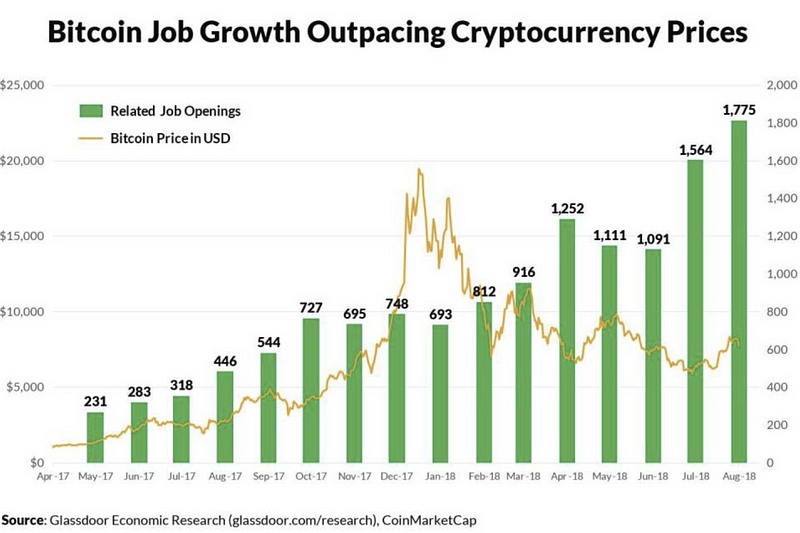
The 1,775 blockchain-related job openings in the U.S. in August 2018, is a 300 percent increase over the same period last year, highlighting the fact that employers remain confident in the crypto market opportunity, and continue to make long-term investments in their teams, even though the crypto market cap is down 70%+ from its highs.
This proves companies and businesses are targeting technically savvy people to join blockchain development efforts, even though the price keeps falling.
It’s incredibly important to see there’s little correlation between blockchain-related jobs and bitcoin prices.
Conclusion
Although price keeps falling, each time we hit new lows, they becoming higher than the previous. The exact same is happing to new highs. If we align low volatility to the previous points, and we take into account the whole argument made, I perceive Bitcoin’s price will sooner or later moon.
What I’ll keep doing is averaging losses and purchasing cryptocurrencies I believe to have a future.
Never forget: markets tend to remain at peak highs for short periods of time, so never miss the best trading days, otherwise, you might seriously hurt future gains.
Disclaimer: The views expressed in the article are solely that of the author and do not represent those of, nor should they be attributed to CCN.com.
Featured image from Shutterstock.
