Bitcoin Price Breaks through Resistance for a Surprise Rally


Well, as many have noted in the comment section, my warning of a possible short-term fall in Bitcoin price Friday coincided very well with a RISE in price. I wish it weren’t so, but it happens.
As my readers likely know, my published long-term forecast is for Bitcoin price to rise for the next several months. Trader’s strategies differ, but I am of the opinion that if the trend is up, one should only trade long, and not short. Conversely, if the larger trend is down, only trade short. Scalpers, of course, disregard this logic every day. Sometimes it is profitable to trade against the trend, but in my experience, in the long run it hurts you because surprise moves are usually in the direction of the larger trend. Such was the case the other day.
I point this out only to remind readers that IMHO one should only be taking long trades in this environment. At times of expected weakness, my personal strategy is to go flat and try to resist the urge to short. Hence, I exited my long position and then sadly watched the market break through the 2×1 Gann angle to the upside. Like I say, it happens. In hindsight, I would have been better off I had stayed long. But hindsight is 20/20.
One problem we must wrestle with is that markets are fractal, which is to say that multiple different setups “work”, in that they provide a framework that the market respects. Gann called the phenomenon: “wheels within wheels”. The problem is knowing in advance which setup is the “best”. The best being defined as the one that’s going to show you exactly where a move will end. I’ve been doing this for years and that is a magic pill I haven’t found yet. I retain hope that I will find it one day. Time will tell.
For example of different “reasonable” setups, here is the bear setup I looked at on Friday:
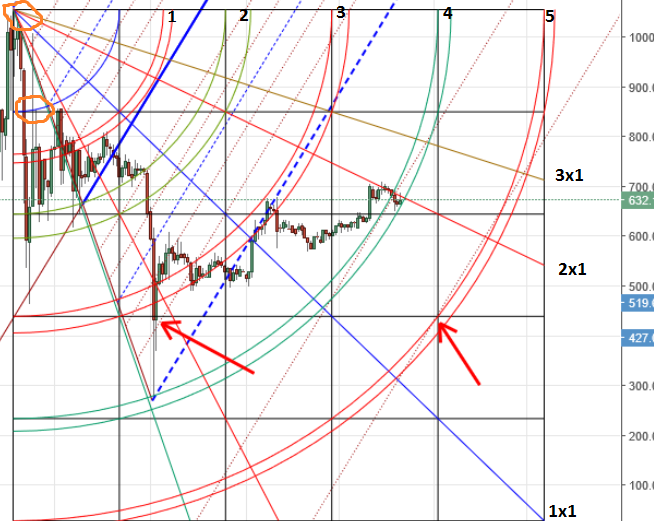
Note the orange circles on the upper left to see the candles I used to size the square. There are several places we can see the market respond to the geometry of the setup. According to this setup, it still looks to me like the market was in a weak position at that time. The 2×1 angle had been successfully resisting for several days, and the first of the 4th arc pair arcs had been broken, as had the 1.618 extension of the pitchfork. The 2nd arc of the pair clearly could provide support, but that seemed a “long shot” given the apparent strength of the 2×1 Gann angle resistance.
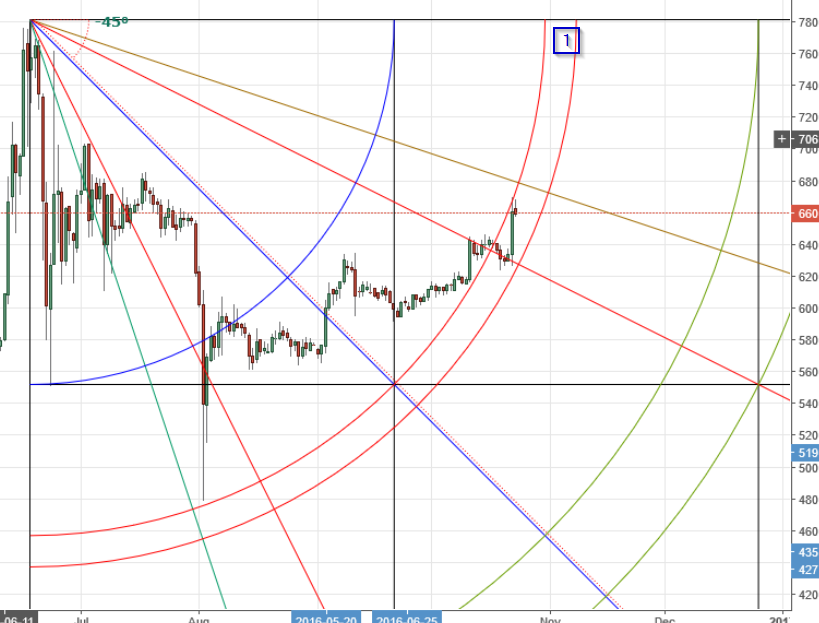
But we must ask: is this the “best” bear setup? I’m not 100% certain. There are a couple other reasonable setups to consider, such as this one:

This also a reasonable setup, and shows that the recent rally occurred exactly at the end of the square, which is a common occurrence. Also note how the top of the square was resistance and then became support.
Lastly, let’s look at the final of the “reasonable” bear setups. In this case, the setup is drawn all the way to the bottom of the spike low. In this case, we see that the rally yesterday was stopped by resistance from the 1st arc of the 1st arc pair, after it found support at the 2nd arc of the pair.
 As I mentioned in my last article: “anything can happen while pricetime is traversing within an arc pair”. The reason, as I understand it, is that you have one arc acting as support and the other as resistance, during that time. You can see an example of that here.
So which of the three setups above is the “best”? I know of no way of knowing in advance. And I can’t show every possible reasonable setup in every article. I must go with the one that appears to be the best, or at least the one that is showing the most imminent major s/r, and hope I am correct. Fortunately, most of the time, all the reasonable setups draw similar S/R…
In conclusion, having missed the rally yesterday, I for one will not try to chase this rally. I will wait to see if bitcoin price can get through the 3×1 angle just above. If so, I might consider entering another long order, with an eye toward caution when pricetime finally gets to the 2nd arc of the pair again. I can’t shake the feeling that this is still going to test the lows. I for one would rather miss a rally or two than keep a long position open at obvious points of weakness on a chart. But of course, that is an opinion question…
Happy trading!
Remember: The author is a trader who is subject to all manner of error in judgement. Do your own research, and be prepared to take full responsibility for your own trades.
