Bitcoin Price – Trading vs Investing


 A comment/question was raised on yesterday’s article that deserved reply, as well as clarification here. The question centered upon the difference between trading and investing. There is a big distinction between trading and investing. IMHO investors should feel very comfortable buying at these levels and ignoring the ups and downs that happen each day and week.
Prices may go lower. They may test $304 again. However, I remain of the conviction that the price will be much higher in a year’s time than they are today, so if prices go lower near term investors should not worry too much. If/when coins sell for $1,000+ it won’t matter very much if you bought at 300, 310, or 350.
Trading is a different animal altogether. Trading is not for everybody. I am a trader. I look forward to falls in price because if I play my cards right I can sell my coins and buy them back cheaper. But if traders make a mistake, and we all make mistakes from time to time, we can easily end up better off if we had just invested for the long term.
The conclusion is that my trading recommendations (such as my current suggestion to take profits at $344-$346) is for active traders only. Investors can and should ignore these trading suggestions.
Another comment was made by an Elliott Wave counter who disagreed with my wave count. I do not dispute the assertion that my wave count could be wrong. The best wave counters always have a “preferred” count, and an “alternate” count simply because it is so difficult to know for sure your count is correct in real time. It is far easier to count waves that have already completed, obviously, than waves-in-progress.
The conclusion is that it is important to recognize at all times that your position as a trader may be mistaken. Be on the lookout for warning signs that the market usually gives us in advance. Whenever you see such signs, have the emotional maturity to admit the error and change your position rather than stubbornly insist you are right even as the market is rolling over you. The markets are littered with broken traders with blown-out accounts who failed to learn this lesson in time.
One warning sign I see regarding my current position as a bullish trader is the short term charts are still looking like they are struggling with every overhead resistance. This is cause for concern for short term bulls, imo.
Mind you it’s great that we got on the right side of this trade! Perma-bears lost $30/btc while we made $30. Still, the market might be subtly warning us that my count is wrong. I am prepared for that. My readers should be as well, particularly since I will soon not be able to update these pages for at least the next several weeks. Again, this warning goes out to traders more than investors.
1-Day Chart
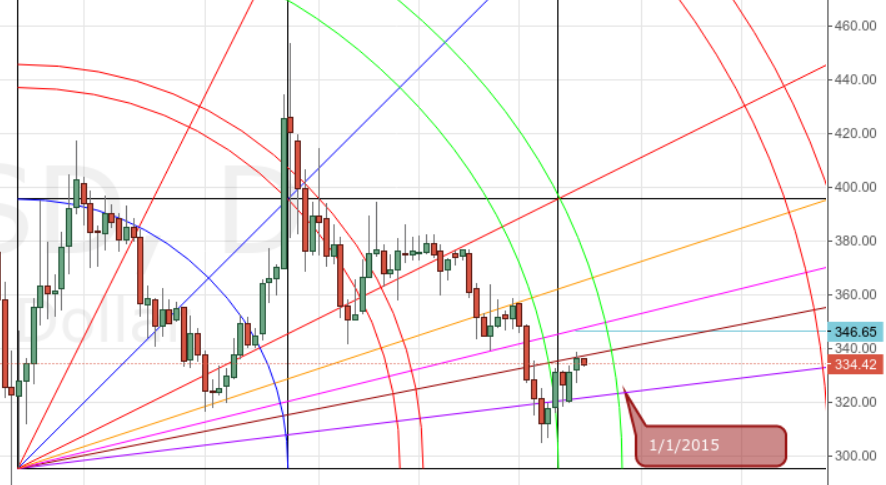
In this daily chart’s bullish setup, price has penetrated the 2nd arc resistance. It is being supported by the Gann 8×1 but is facing resistance from the Gann 4×1. Price will clear 2nd arc resistance ~ Jan 1, 2015. Perhaps the 2015 Bull Market will begin in earnest ~ New Years Day.
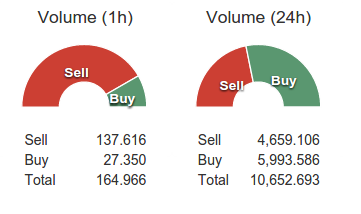
The price ratio page shows there are currently more buyers than sellers.
Happy Trading all!
Disclaimer: Trading is risky. Past success is not a guarantee of future profits. CCN.com assumes no liability for any losses suffered as a result of this analysis.
Images from Shutterstock.
