London Institute Uses 64 Monitors to Demonstrate How Bitcoin Works

The Imperial Data Science Institute in London has an exhibit of 64 monitors with lines moving in geometric shapes representing real-time bitcoin transactions, according to The Imperial College of London website .
Harry Pettit, a graduate student, recently visited the exhibit and discovered it provided a unique way to visualize transactions, according to a news story on the college website. The institute houses the world’s most advanced data visualization platforms. Pettit visited the institute to learn more about bitcoin.
32 Computers For 64 Monitors
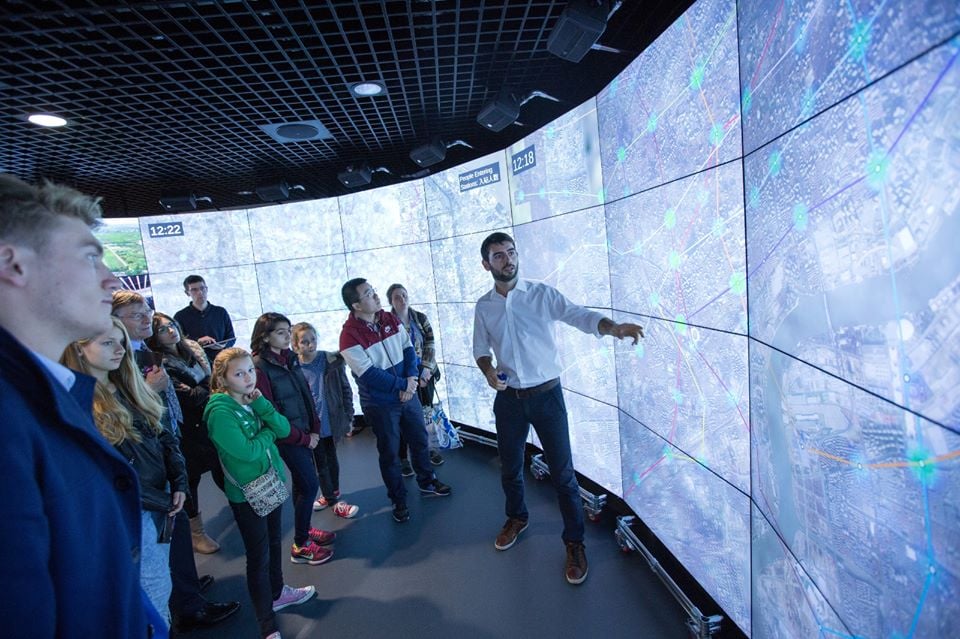
The institute houses the KPMG Data Observatory, which has a circular wall of 64 monitors managed by 32 computers that support 313 degrees of surround vision, according to the institute’s website. The institute provides a way for industry and academia to visualize data in ways that create new insights. It also promotes the communication of complex data in a multi-dimensional environment.
Pettit was guided in his visit by an Imperial graduate student, Dan McGinn, who worked on the bitcoin project while earning a degree in computing science.

Lines Represent Transactions
The bitcoin demonstration room has 32 big computer screens that curve into a horseshoe in the center of the room. Short lines dance geometric shapes, each representing actual bitcoin transactions.
McGinn explained that the reason bitcoin works is that each transaction is public. He described how the transactions are organized into data blocks that anyone can see.
The screens on the wall split into several segments, allowing the viewing of bitcoin trades from different perspectives.
McGinn explained the purpose of the project is to shed insight on new ways to read intricate data and to create patterns that would otherwise have an unreadable stream of figures.
Every bitcoin transaction is represented as a line between a seller and a buyer, with big traders sprouting numerous lines at a time. Such visualizations indicate which of the trades are “human” and which are automated in the shapes they produce.
Also read: McGill University students learn cryptocurrencies through guerilla education
Representing A Spam Attack
Pettit examined a segment in which thousands of little transaction lines wind and twist over each other into a serpentine data column. McGinn explained that the image represented a big spam attack on the bitcoin network that took place last year. Such attacks undermine bitcoin’s potential, he said.
The bitcoin system can manage three to seven transactions per second, a low rate compared to other financial networks.
An algorithm that would overload the system would cause a breakdown that would make transactions take 12 to 14 hours to complete. Such a scenario would give attackers a chance to steal bitcoins in wallets with weak passwords since the communal system’s security would be temporarily lost.
The transactions Pettit was viewing were evidently automatic. One snake-like column he observed struck him as more calculated than some of the other transactions.
McGinn said he was still optimistic about bitcoin despite the attacks that have occurred. He said he believes bitcoin and cryptocurrencies are the future of economics.
Featured image from Facebook/Imperial College.
